SciSports is pleased to announce added functionalities within its Performance Center application by offering valuable usability for users around the world.
The SciSports Performance Center provides clubs and leagues with the ultimate performance analysis tooling for pre and post-match insights. Features within the Performance Center include a comprehensive view in terms of event and tracking data for optimum physical and tactical analysis.
Supporting clubs all around the world means that SciSports is able to bring data-driven insights to a variety of leagues for all types of objectives and styles at clubs.
In this post, we take you through the Export Markers feature to show how it adds direct value to the workflow of analysts in various forms of match analysis.
Through the Performance Center, users have access to a wealth of information sources for both pre and post-match analysis. In this post, we will be looking at how the Export Markers feature adds value to the workflows of performance analysts at professional football clubs around the world.
Using SciSports tooling enables analysts to be flexible in their approach to all types of performance analysis with a highly accessible workflow. In this steps below, we identify an effective workflow that can get the most out of data-driven performance analysis.
Step 1: Translate key tactical questions into custom searches
The Export Markers feature adds direct value to the workflow of analysts in the sense that it provides flexibility to select the desired on-field events supported by both event and tracking data for video analysis. Through the Performance Center, video analysts can begin to answer key questions in terms of checking post-match how the team performed based on the pre-game defined tactical plan. From there, users can directly report back to the coaching staff and players.
Some exemplary questions that can be answered through this way of working include:
- How did the team perform in build-up play via the flanks?
- Who created the most chances via the half spaces?
- Which player performed the most counterpressure moments?
By directly finding these moments in video through a data-driven solution, video analysts can save time and effort to effectively analyse these moments in-depth. Rather than spending time to find these exact moments, the Performance Center frees up more time for communicating trends and patterns with other staff to ultimately relay to players and coaches.
Furthermore, translating key tactical questions is not limited to just your own team. By looking across the league, users can look at the performances of upcoming opponents to, for example, find tendencies in their game principles and therefore devise an effective game plan.
- How does the upcoming opponent create their chances?
- Who is their most frequent ball progressor to the final third?
- What trends do we see in their way of attacking and defending?
All of this information helps to build a bigger picture of the upcoming opponent and makes the team as prepared as possible. Keeping these key tactical questions in mind can allow users to get the very most out of custom searches in the Performance Center.
Step 2: Select event types to analyse patterns and trends
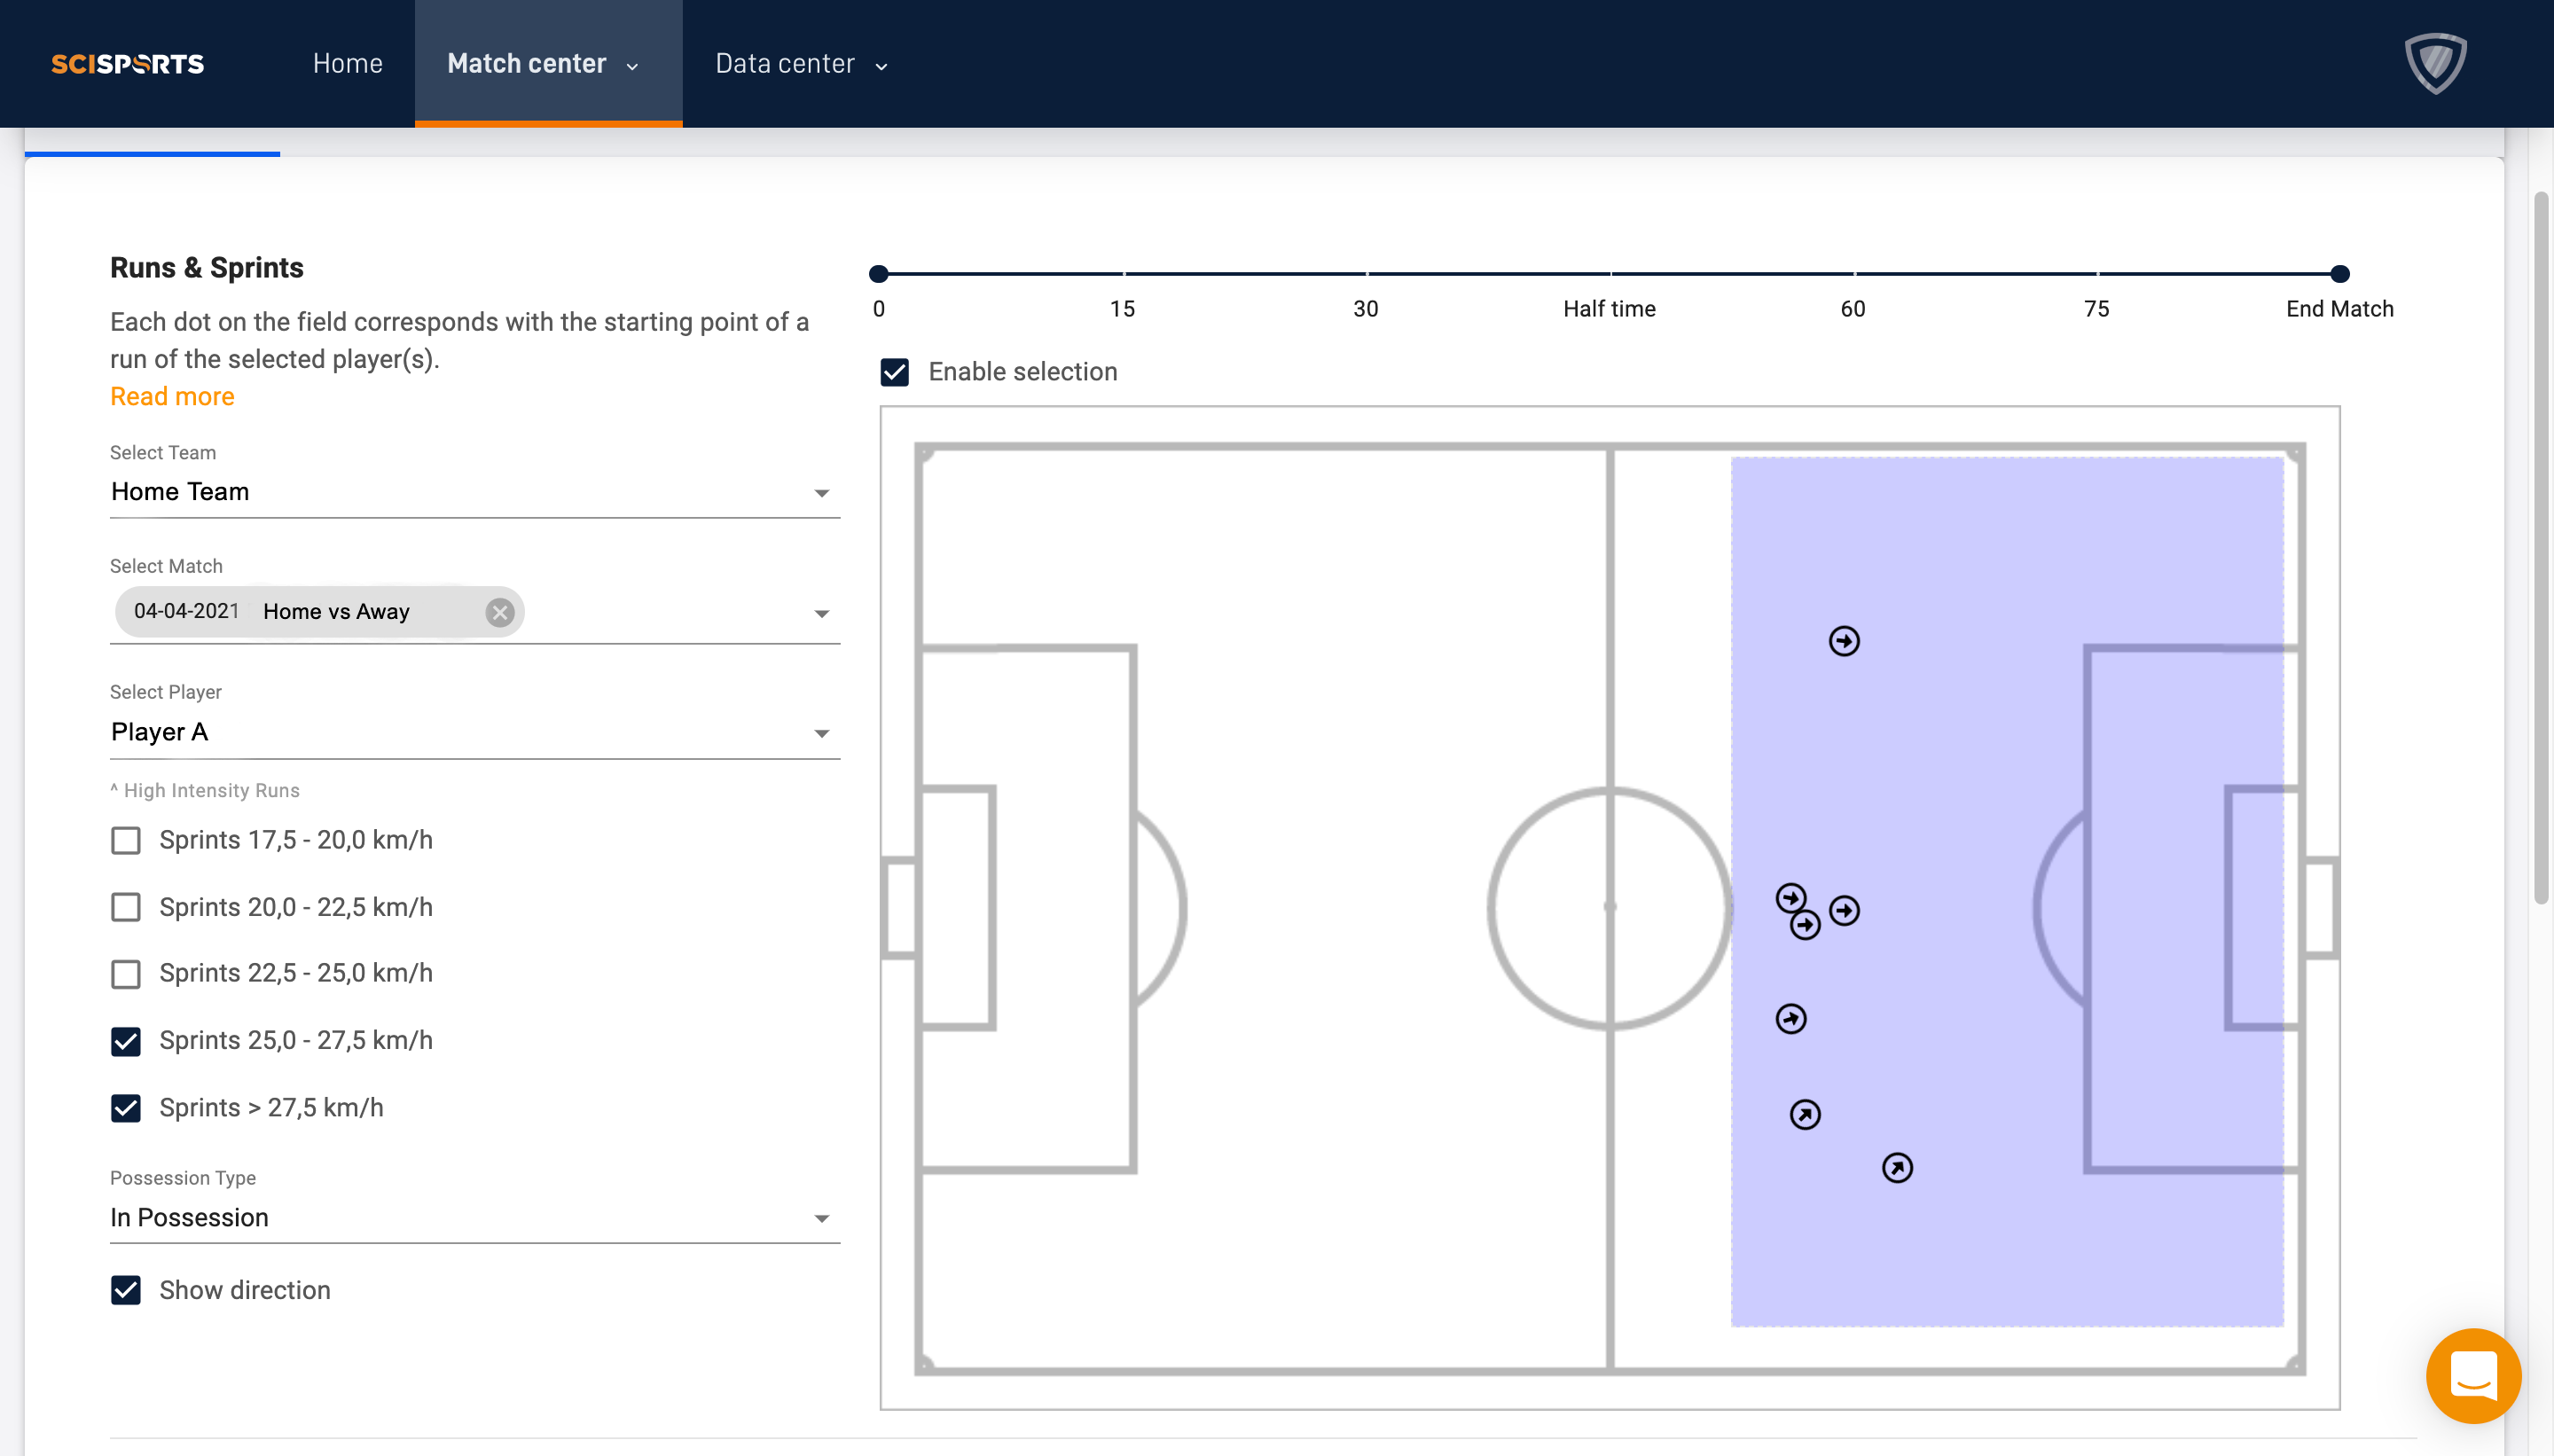
With regards to translating key tactical questions, being able to select certain event types can identify patterns and trends. In this example, we show how the Export Markers function provides endless possibilities through the use of data-driven event coding. In this example, we take the role of analyst wanting to review all of the in-possession sprints performed by a certain player within the final third of the pitch. Not only that, but we want the sprints to be at least 25.0 km/h during the selected match.
To do this, we go to the Tactical Reports section and, under Runs & Sprints, filter on the desired selection as shown below. As you can see, further filtering options are also available in terms of timeframe, match, sprint speed and possession type.
Figure 1. Select the desired events through the Performance Center
Step 3: Run the Event Viewer to get synchronised data and video fragments using AI
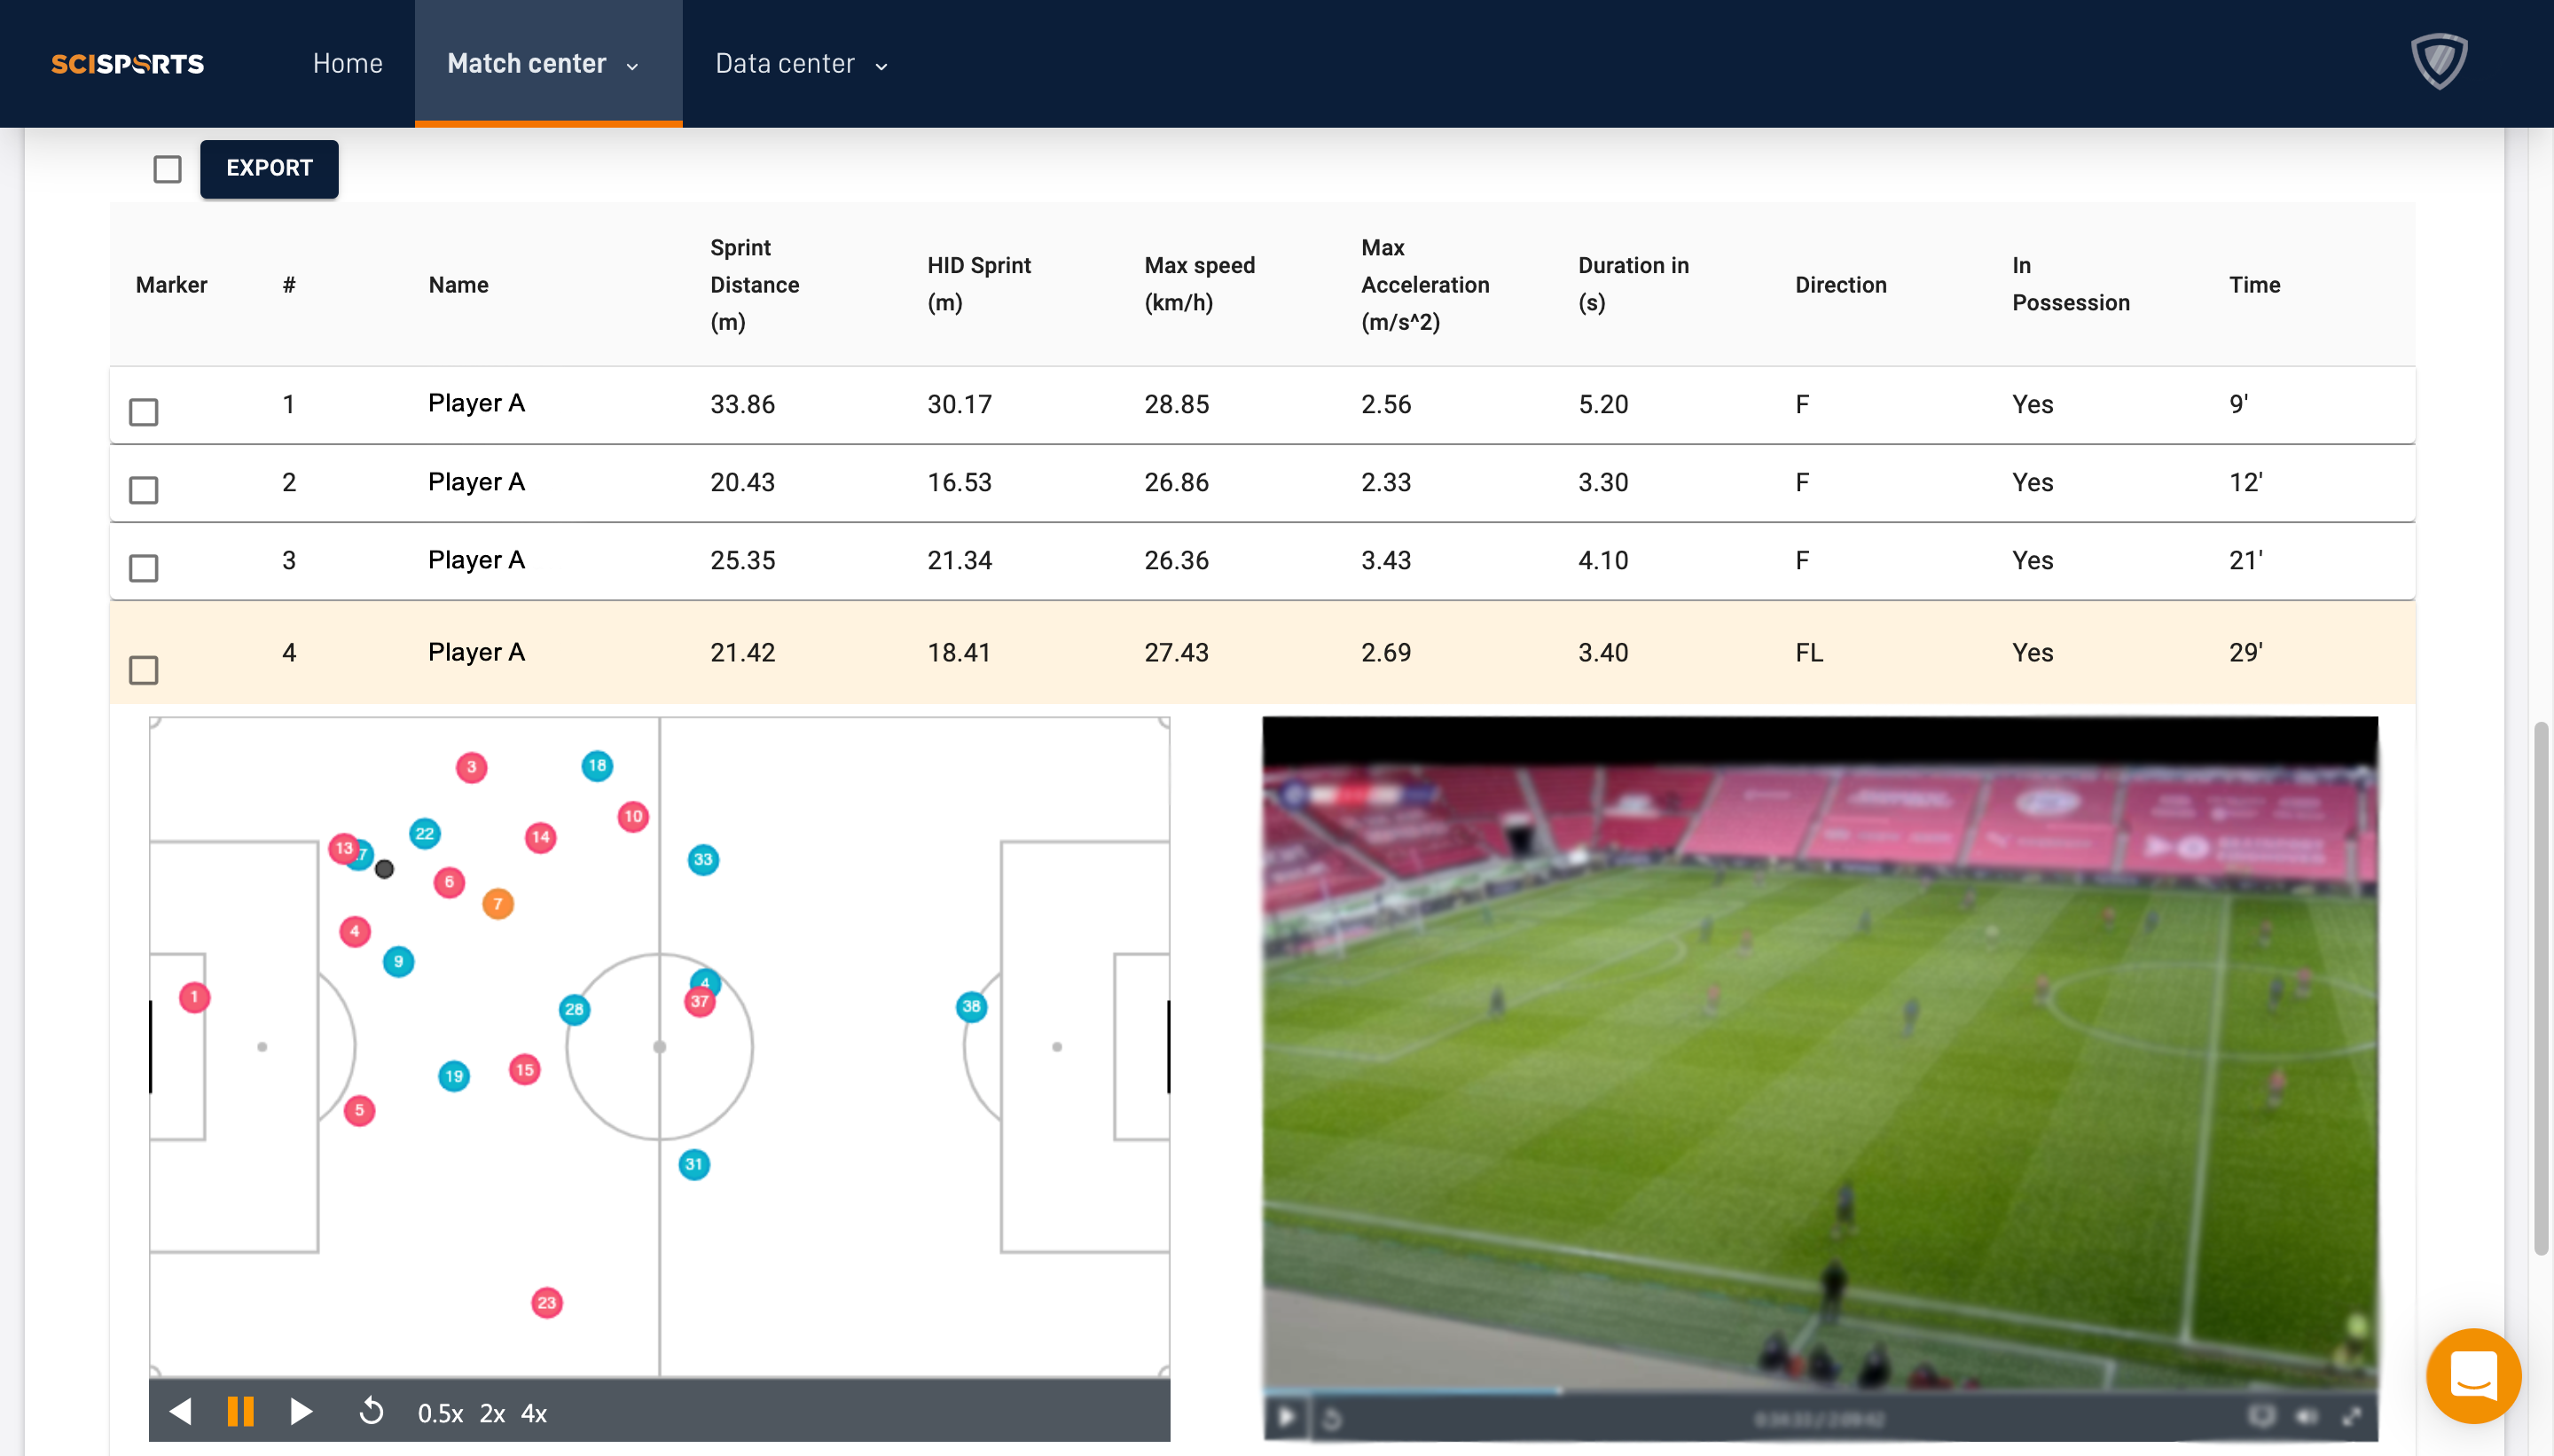
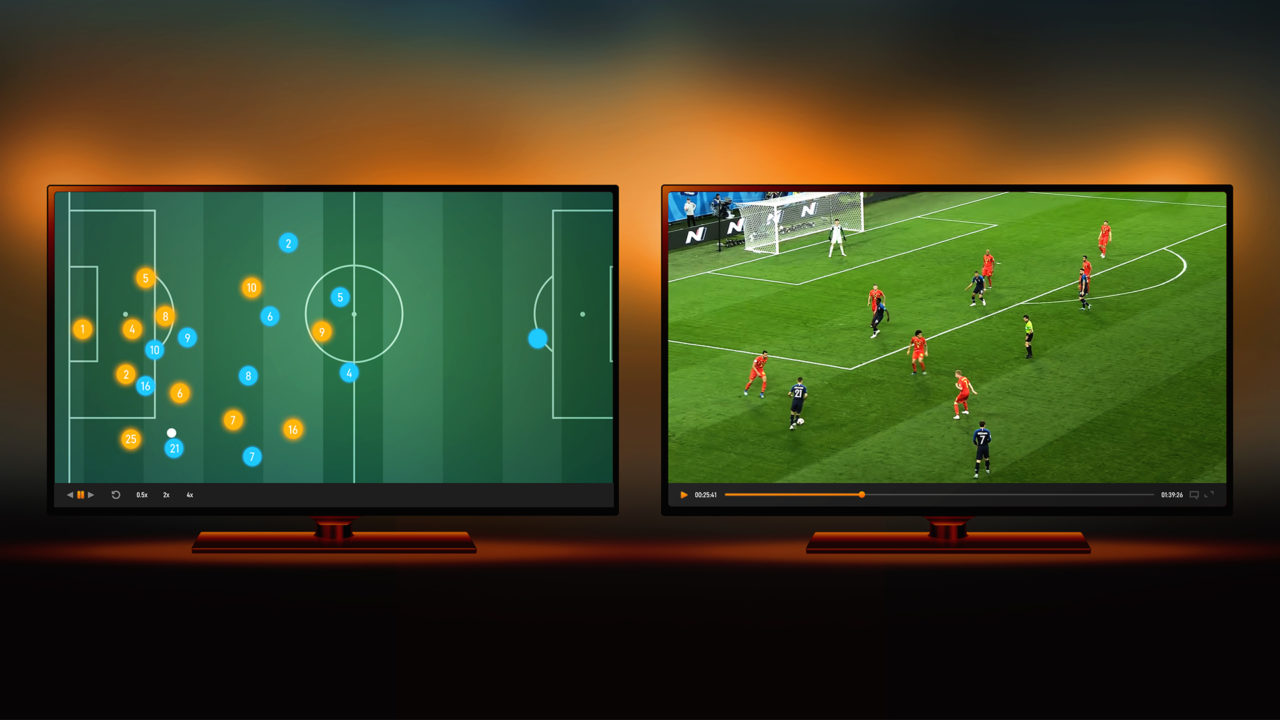
When selecting the desired events for in-depth analysis, better understanding context around the event can help to provide more information. This is achievable through the Performance Center’s synchronised data and video fragments. By selecting the sprint in the field or in the table below, the analyst can then pick the relevant sprints based on video and 2D visualisation. This adds an important layer of information to the situation both in terms of the event’s context as well as the exact location provided by the 2D screen.
Figure 2. View sychronised events in video and 2D shape
Step 4: Export data insights directly to your favourite video tooling
Identifying relevant events through the match is important, but being able to integrate this process into an efficient workflow is equally valuable to performance analysis overall.
Users can directly download XML files to external video analysis tools with clear timestamps provided for ease of use. If an analyst wants to directly look at Potential Opportunities created for the team in certain areas of the pitch, a selection can be made through the Performance Center and then subsequently exported for integration into third-party reporting tools such as Sportscode or MyVideoAnalyser.
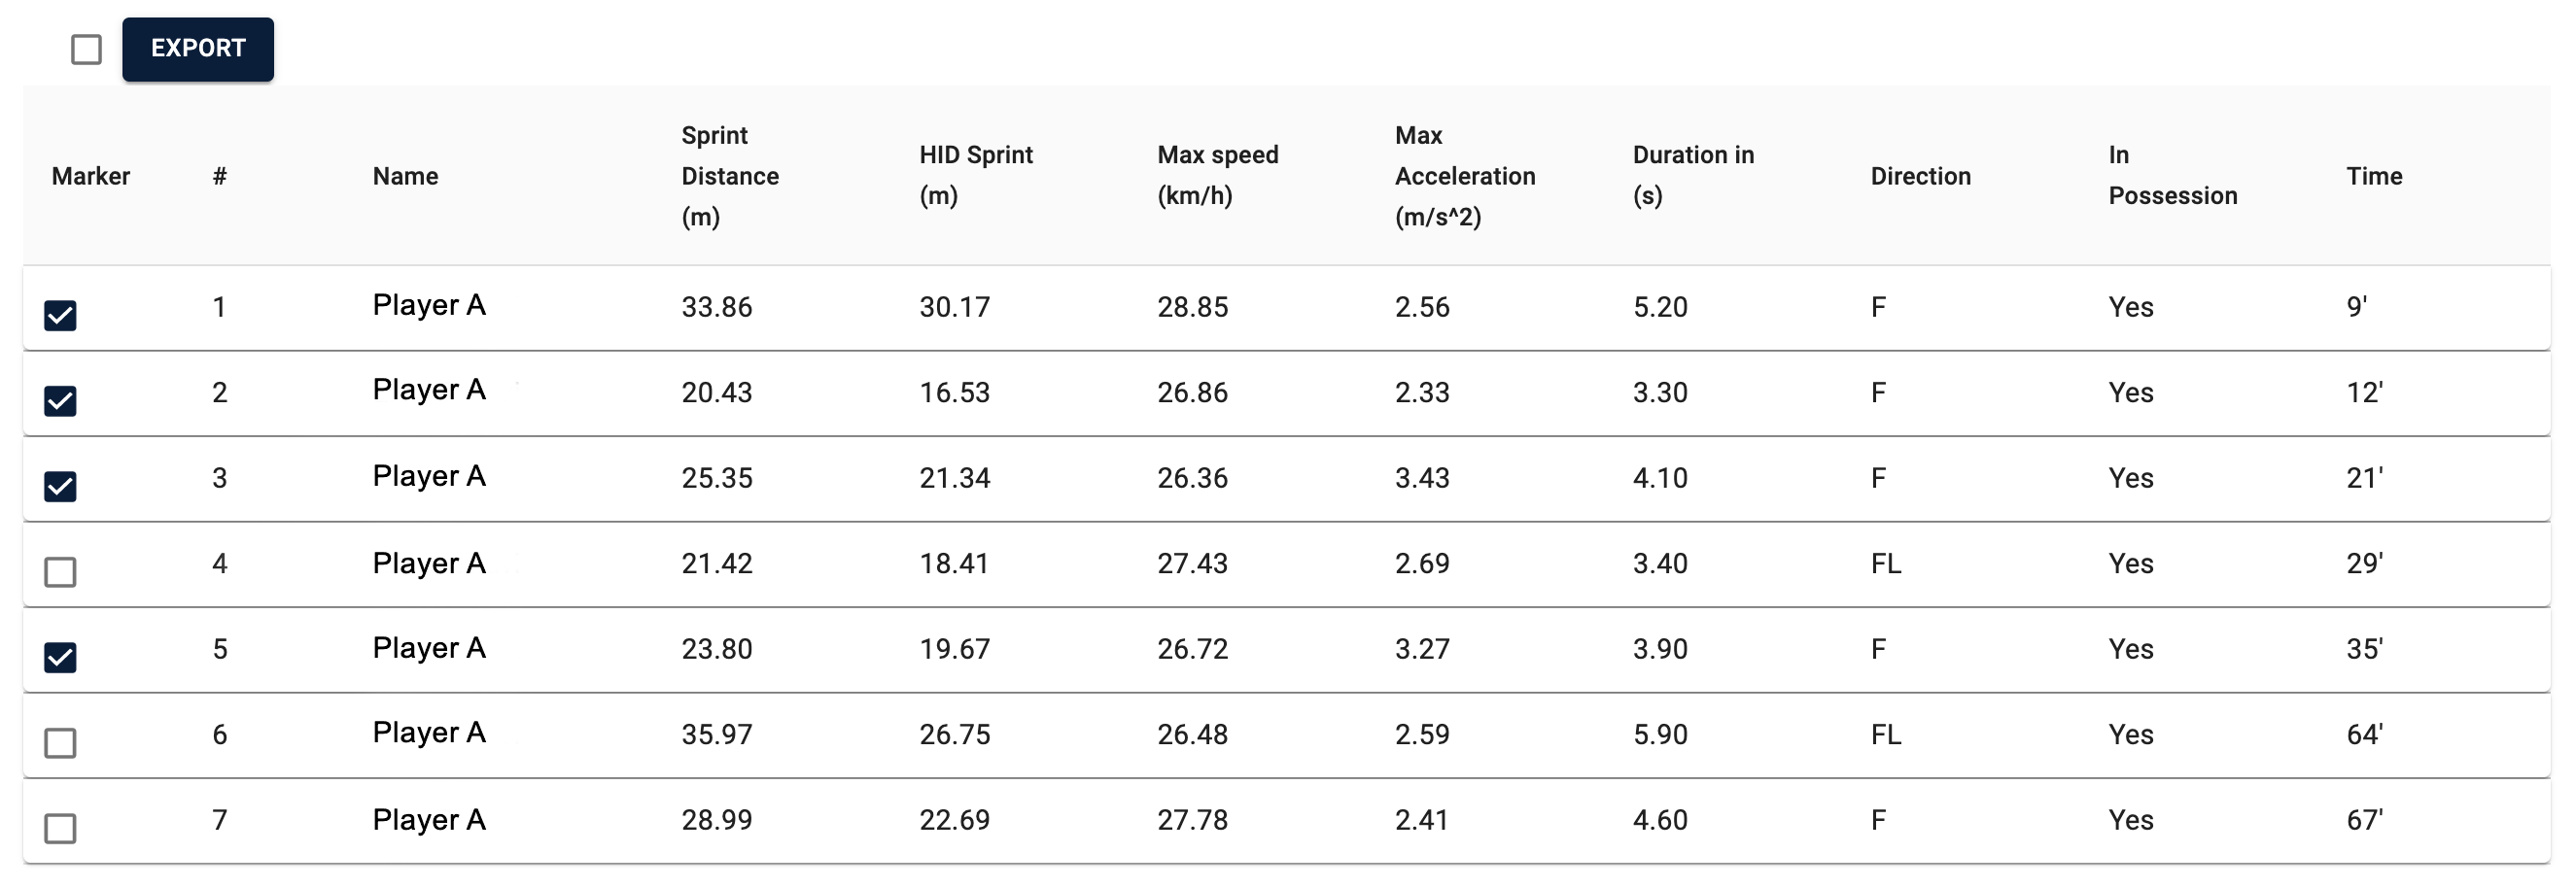
After detecting and selecting the relevant events, these can either be viewed within the Performance Center or exported. Firstly, users can select all of the markers they want to export and then press the export button to download the XML file that is compatible with most video analyser tools.
Figure 3. Directly export the events to your desired video analysis tooling
Step 5: Analyse video fragments in-depth using context from a data perspective
From here, users can use the exported file to integrate into most video analysis toolings. After importing the XML file and aligning the video, everything is ready for video analysis.
Users can now find the selected sprints in the timeline and work with them as if they are created within their own code window. Instead of having to manually code the match, this way of working results in more time available to analyse and present the video fragments in-depth rather than spending time on coding and collecting the right video.
What is the added value of this feature?
Our aim is to add value to analysis departments in several ways. One of the key aspects is to help automise as many tasks as possible for an improved workflow. By doing this, clubs are then able to spend more time on their areas of expertise such as video analysis, rather than having to code games themselves.
Using a data-driven method to code match events ensures a highly efficient workflow within analysis departments that are under significant time pressures. As a result, working in this way over an extended period of time not only provides more direct insights but also does it in a clear and concise manner.
The Export Markers tool ultimately allows users to download the relevant events from the Performance Center straight to your video tool. With the additional features demonstrated within the SciSports Performance Center, pre and post-match analysis can be really focused on the things that matter.
Find out more about our match-winning performance analysis insights
Working in the professional football industry and want to find out more? Get in touch below!

