SciSports’ Physical Indicators present a one-of-a-kind way to analyse the physical performance of a player. Including metrics such as Speed and Stamina, you can find and evaluate players in accordance with their physical output.
In this blog post, we take a look at the influence behind the metrics, how they are computed and the end result for users in the industry.
INFLUENCE
There are some frequently asked questions when it comes to scouting footballers.
- Is this player fast?
- Can this player adapt to our league’s intensity?
While neither question can be answered with one single metric, the Physical Indicators go some way to providing an indication of whether that could be the case. Measuring Speed and Stamina are two of the most in-demand things for scouting departments.
By creating indicators that place these physical attributes within a football context, we hope to provide more insight to the end user and ultimately improve data-led scouting in the professional game.
DATA METHODOLOGY
SciSports’ physical indicators are produced via a machine-learning model that transforms raw event data into physical insights. Relying on years of experience working with different types of data sets and internal validation studies, we were able to create these unique new metrics.
To compute the end result of the speed metric, we take a player’s average speed per match across all matches in the last 2 years and compare it against data from players who played a similar position in that league during that time frame.
The widespread availability of event data means that we could create metrics to measure physical performance on around 130 leagues worldwide. However, the methodology behind doing so deserves some explanation.
In essence, the metrics are created by computing displacement attributes between events. What this essentially means is that we take the events performed by a player on the pitch and transform those into what we call SciSports Actions.
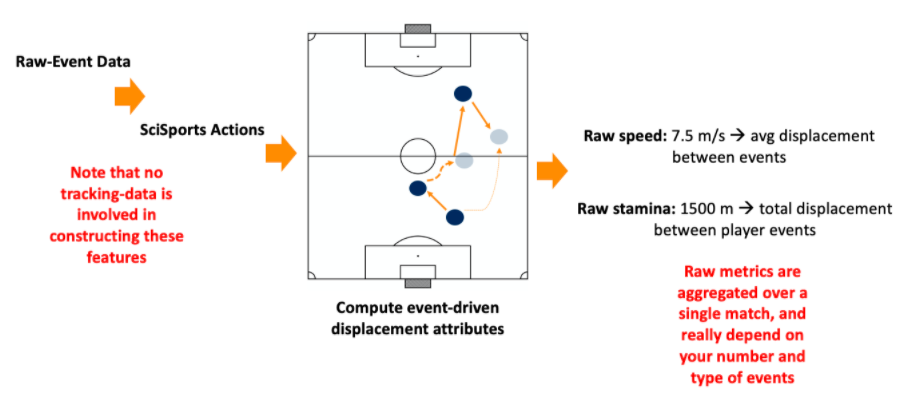
Figure 1. Calculating the Physical Indicators by event-driven data
At this stage of the research process, we took the decision to create an aggregated value of the data for multiple reasons. Firstly, the differences in values between position groups means that an aggregated value makes it easier to benchmark within a position and league – a particularly important point for the use case of scouting. Furthermore, raw values result in less accurate insights since they are not normalised per match or at a limited number of minutes. All of this, plus the fact that aggregated scores make in-application insights more suitable, means that the physical indicators are provided in a secure way to the end user.
You can read more about the methodology behind the metrics over on our analytics domain here.
SPEED
The nature of the data methodology means that we are mainly concentrating on a player’s events on the pitch. From that perspective, the speed metric is designed to evaluate the player’s Speed in relation to the events that they perform on the pitch. As opposed to knowing how fast a player can run over a 50-meter sprint, looking at moments when the player is in or close to being in possession provides more relevant footballing context.
To calculate the Speed, we derive the SciSports Actions and calculate the average displacement between events. What it means in simple terms is that we are evaluating how quickly a player is completing set sequences on the field and deriving a Speed value from that. Delivered in m/s as the raw speed, we then aggregate the data as explained above to benchmark against others and deliver the insights within our Recruitment app.
STAMINA
Like Speed, the Stamina metric is calculating the displacement between events that a player makes on the pitch. To measure the stamina of a player, we examine the total displacement between the actions that a player performs. This means that the return ‘raw’ value is a total number of meters covered in a match – as opposed to the m/s for speed.
By doing this, we find something that correlates extremely close to the true distance that a player covers on the pitch.
PHYSICAL INDICATORS IN USE
From a scouting perspective, the metrics have been created to provide direct insights relative to other players in the same position and league. So, in the case of analysing a Bundesliga winger, they will be ranked against other wingers in the German top flight.
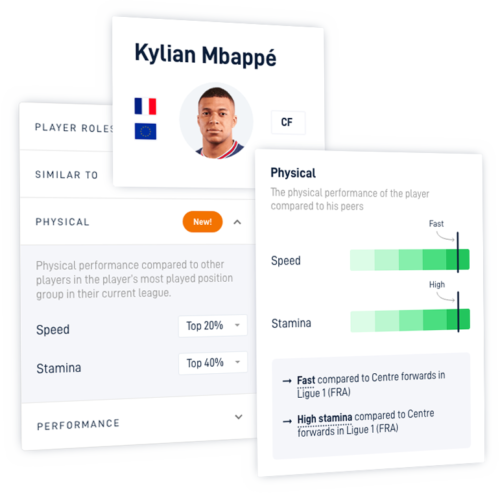
As shown below, this can be achieved through using the Physical filter within the Players tab (left) as well as directly on the Player Page (right).
Figure 2. How the Physical indicators work in-app
By being able to view a player’s ranking within their league and position, the Physical Indicators provide a contextualised way of scouting players through data. In addition, the filter option allows users to do this within their shortlisting process early in the scouting phase.
USE ONE-OF-A-KIND PHYSICAL INDICATORS!
Interested in learning more about our one-of-a-kind Physical Indicators? Contact the team via the button below.

