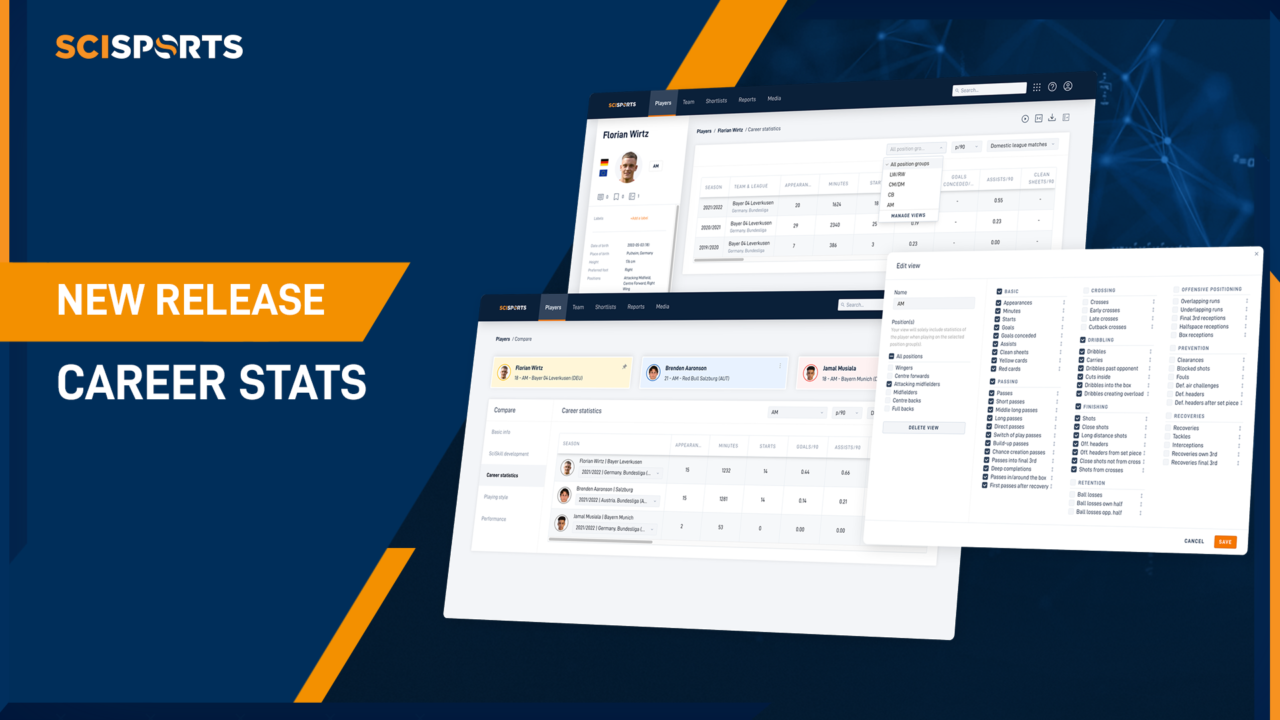
After releasing next-gen analytical metrics such as Performance Metrics (SciSports’ possession value model), 22 predefined Player Roles and most recently the first of its kind event-driven Physical Indicators, we now add an extra number of fundamental insights to our player recruitment product.
We’re happy to announce that we integrated well-known stats categories such as shots, passes and dribbles into our industry-leading product, in our mission to help make the life of football professionals easier using actionable insights derived from football data.
With the tools to search, compare and store all professional players around the globe digitally, our instant growing client base stays one step ahead of their competitors in the market.
The Recruitment application offers a wide range of functionalities and the Career Statistics page is a great way to contextualise data-driven insights through more commonly used player metrics.
In the updated Career Statistics page, we have added 110 new data points- 55 action types for both totals and per 90. This data is now available to all customers through the Recruitment application or via an API.
Highlighting the value of the new releases, Johan Vuegen, Chief Product Officer at SciSports said: “We know there is the urge to get as many insights on a player as possible. Our Recruitment application already offered many insights on advanced metrics. Adding the Career Statistics provides users an even more complete view of a player. Having the possibility to view the Career Statistics per position group is of great added value in evaluating the performance of players.”
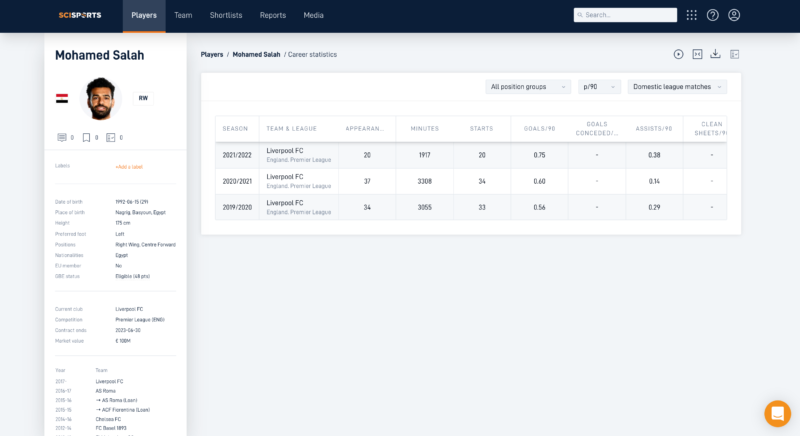
Users now have the option to view a chosen player’s general data from the last three domestic league seasons – including basic information like appearances, minutes played, starts, goals and assists. You can also dive deeper and filter your view based on 50+ specific metrics like dribbles, cut back crosses, chance creation passes, etc.
As shown below in the case of Mohamed Salah, these numbers are presented on a season-by-season basis and can also be normalised to a per 90 minutes basis.
Figure 1. Overview of the Career Stats of a player over the past 3 seasons
This standard view can also be customised by creating position profiles tailored to the metrics you find valuable.
Creating position profiles
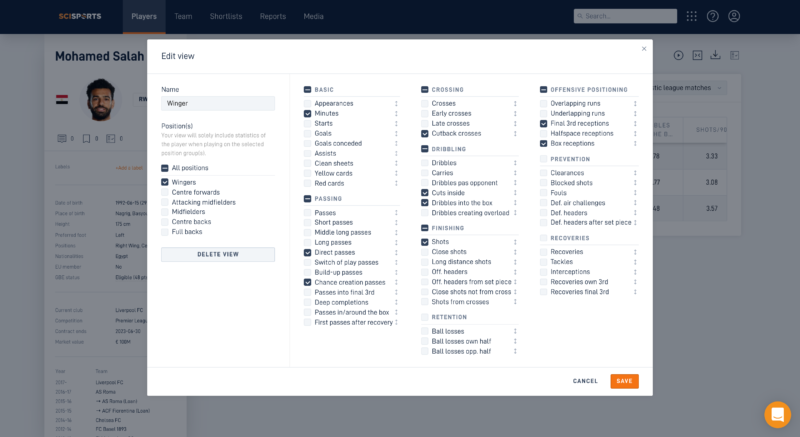
In the ‘All position groups’ tab (Figure 1) you can create and manage your own views based on position profiles from 50+ metrics available. Below, you can see that we have created a profile for wingers.
Figure 2. Customise and save a positional positional profile according to your needs
Creating positional profiles is useful as you can customise the view based on what statistics you think are important per position group and cut out the information that is not useful. The ability to save these profiles also enables you to streamline your workflow and save time.
Once you have done this, you can save the view and return to the overview page to compare the player’s statistics for your pre-selected metrics. This can be particularly effective when evaluating a player’s development over time and to check how they align with your team’s KPIs.
Comparing players on career statistics
It is also important to compare the statistics of different players and see where they rank against each other. This can be very useful in the later stages of scouting. Further, comparing potential signings to a current player in your team offers an insight into whether they could improve or replace the current output in that area.
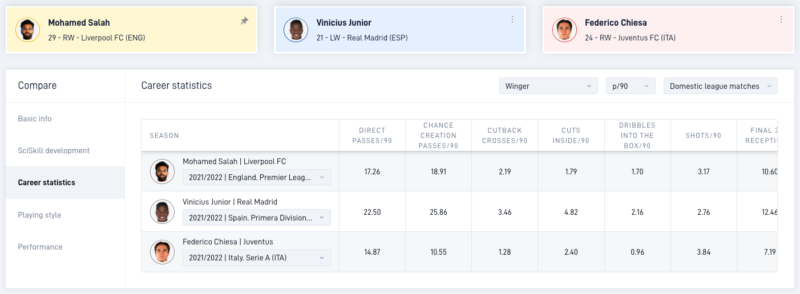
Figure 3. Compare players using the saved positional profile
As shown above, we have directly compared Salah to Vinicius Junior and Federico Chiesa using the Player Compare feature by navigating to the Career Statistics tab and choosing the previously created position profile of a ‘winger’.
Using career statistics to assess a player
Analysing more advanced metrics together with career statistics can give you the full picture of the performance of a player. It shows you how often a player plays for his team and what output he is able to produce in the playing time he gets.
While analysing a player in the player’s overview page, you can immediately see the player’s playing time and productivity for the most recent seasons.
This type of view provides a quick overview on the player’s development over time in basic yet important areas of performance.
IMPORTANCE OF P90 VALUES
Comparing goals scored by two players, when one of them has played more minutes or games can present a distorted picture of player performance.
The use of per 90 values alongside total values is important as it gives added context when evaluating players who play varying minutes over the course of a season. Additionally, the production of a particular stat over a 90-minute period provides a more accurate way to filter and compare player contributions.
Use actionable insights within the SciSports Recruitment application!
Working in the professional industry and want to analyse a player or team of your choice? Request your trial now and get access to the latest data insights.

